The composite score is built from what a supplier actually delivered: non-conformities raised against their deliveries, incoming inspection reject rate, on-time delivery, and how quickly they answer. It is not a rating somebody typed in.
Scores are relative to the weights your organisation set. Two tenants with the same deliveries can hold the same supplier at different scores, and both are right.
Reading the trend
One month's score answers almost nothing. The shape over a year is the useful signal: a supplier recovering from a bad quarter is a different conversation from one sliding quietly.
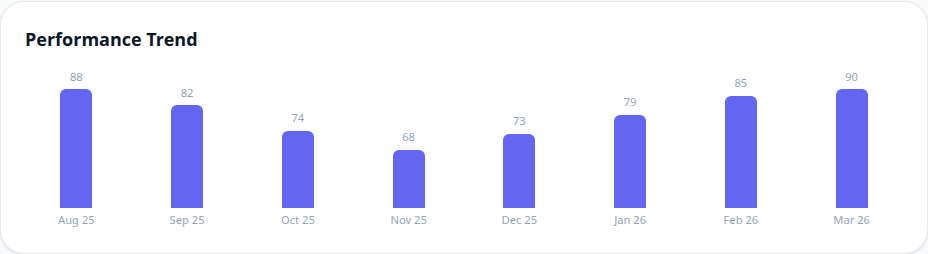
A dip that coincides with non-conformities you raised is the system working.
A flat high score on a supplier you rarely inspect measures your inspection, not their quality.
Hover a bar for the four inputs behind that month.
The bars are scaled to the range in view, not from zero - the point is the shape. Read the numbers above them before drawing a conclusion from a height.